Two questions: Are you intrigued to know how you stack up against your industry peers and what they’re paying their workforce? Are you happy with your current crew pay rates for labor and event staff?
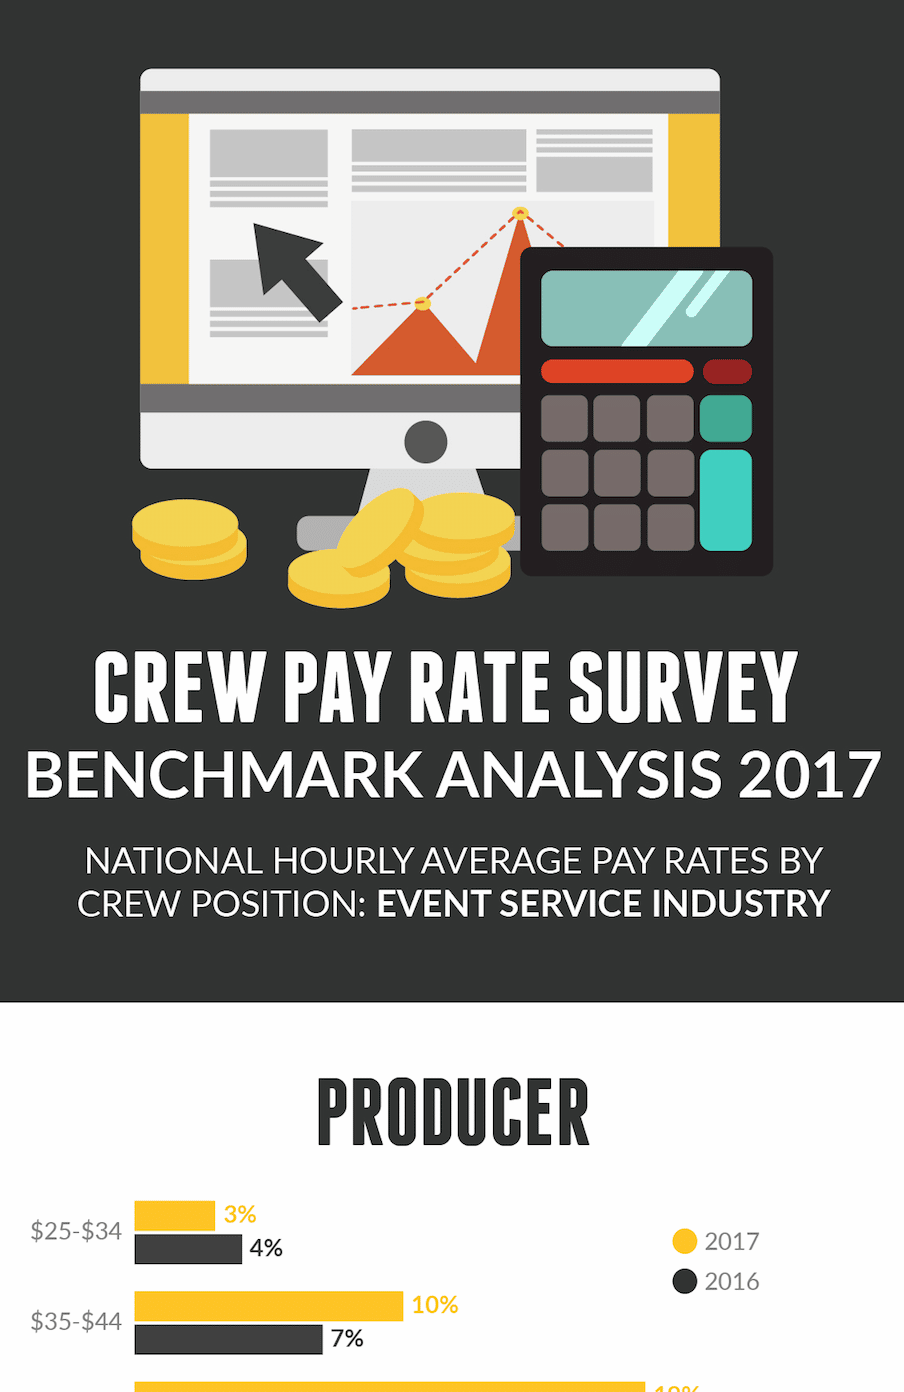
For a second year in a row, those are the questions we wanted to help you answer so we polled event service executives in order to gauge what the industry is paying for their crew – and how those rates have changed since last year. The full results can be found in our 2018 Crew Pay Rate Report. The infographic below highlights 3 of the 14 crew positions that appear in the report.
One of the most interesting trends found in this year’s report was a drop in pay rates from 2016 to 2017. For example, more than a quarter of producers (27%) were paid over $95 an hour last year, but in 2017 the hourly wages are spread out more and now the highest number of individuals (19%) make between $45 and $54 per hour. Hourly rates are dropping for stage managers, technical directors, and others as well.
Why is this happening? We wanted to know what you thought, so we sent out a 1 question survey. The results are included in the infographic. Most companies believe this is due to newer and less expensive talent entering the workforce. With greater competition for gigs, workers have also had to lower pay rates. At the same time, companies are reclassifying crews and are paying less in order to offset other expenses.
Check out this infographic for more results from our 2017 crew pay rate report!


